


Basics of QGIS Map Composer
Introduction
The easiest way to print a representation of geographical data from QGIS is to use the “Save As Image” which will create the picture of the data layers in map canvas. But those pictures would only contain data stylings and its shape geometry. This is useful for a quick reference but we can increase the usability of the map by adding some essential elements.
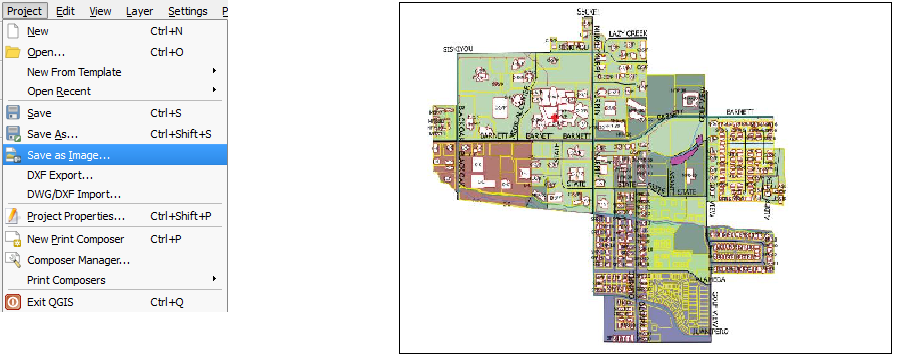
Figure 1. The data layers rendered as an Image
A map contains cartographic elements which help the viewers in basic understanding of that area in for planning, estimation and other developments.
While creating a map, once the data is visualized using different symbology options, there are other elements like Legend, North Arrow, Frame, Grids, Scale bar which are required to make the map attractive and understandable.
Steps to create a basic map using map composer tool is described in this blog.
Using Print Composer in QGIS
- Relevant layers that are to be included in the map should be loaded into QGIS.

Figure 2. Layers loaded into QGIS with suitable Styling
Creating Map Workspace
A print composer is a map workspace where we would be creating the map layout, adding map elements and visualize our resultant map.
- To create a map workspace, Goto Project -> New Print Composer as shown in Figure 3. A composer title window opens as shown in Figure 4, enter the map composer name and click ok.

Figure 3. New Print Composer
- The same data can be used to create multiple map layouts by storing multiple print composers.

Figure 4. Map Composer Name
- A new map composer Window opens as shown in Figure 5. To modify overall page defaults, Go to composition tab in the window as shown in Figure 6.
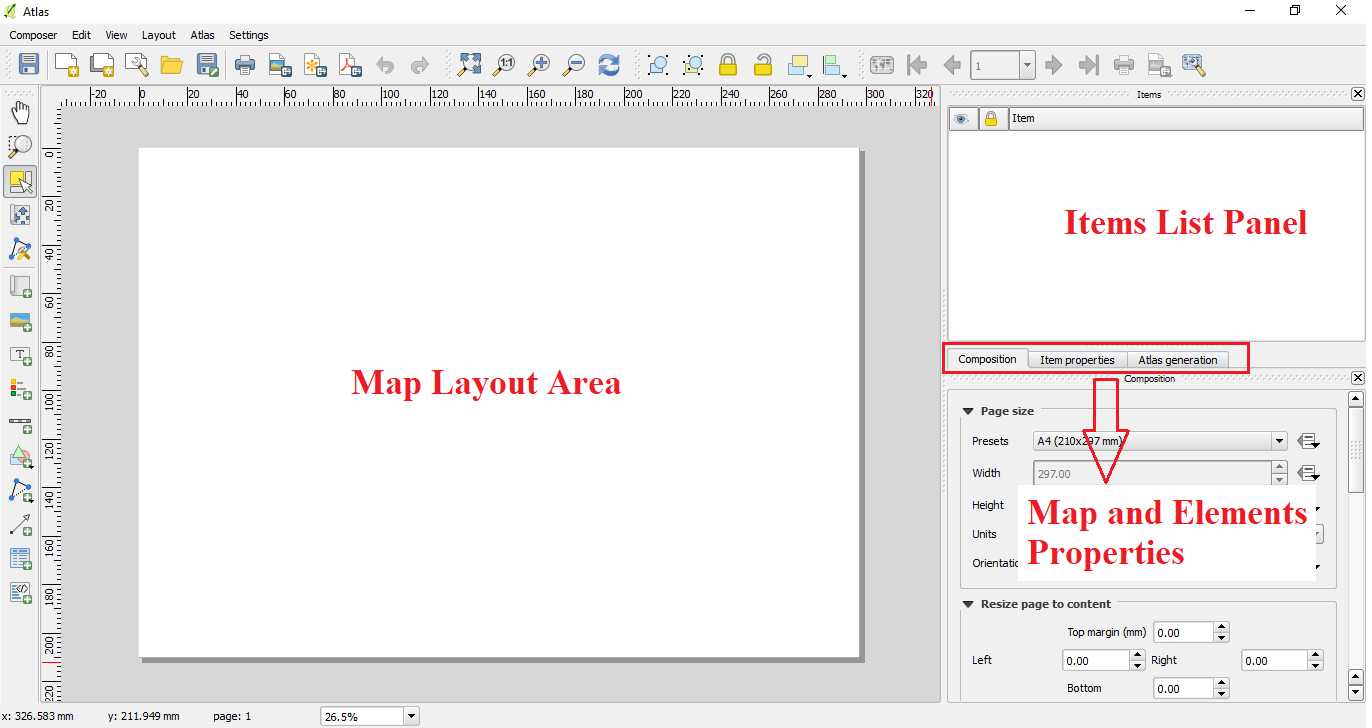
Figure 5. Map Composer
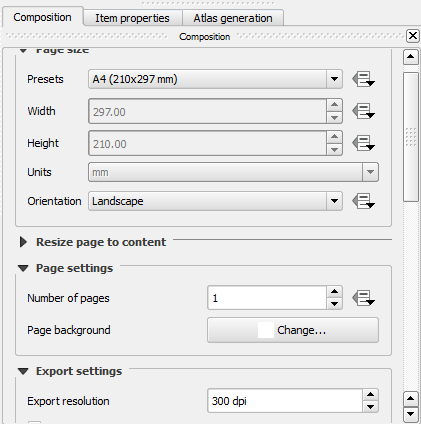
Figure 6. Page Setup
-
Under the “Page size” required paper size and orientation of map are given in Presets and Orientation options respectively. The total number of pages required in the final output and the page background colour can be chosen in “Page settings”. Multiple pages can be used to display ancillary information like linked tables or other notes which will support the map. The resolution of the output map can be enhanced at “Export resolution” as shown in figure 6.
Note that greater the export resolution, higher the map quality and consequently the output size increases.

Figure 7. Page Composition Settings
Add Map Elements to the Layout
Adding Title element
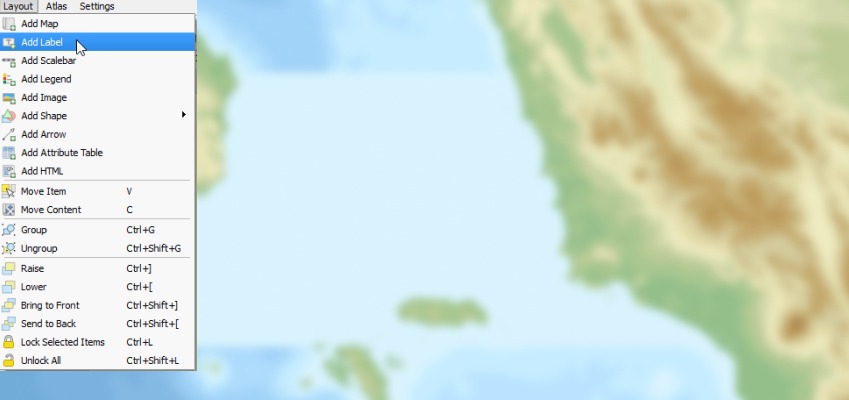
- To add the title for the Map, Go to Layout -> Add Label. Click and drag on the Space where the title is to be placed.
- Though the label can be used to print text anywhere inside map layout area, here the map title is also a large “Label”.

Figure 8. Add Label

Figure 9. Placing Label Extent
- Default text “QGIS” will appear in the added title box and in items list panel. You should edit the text with the title text.
- The Layer will be loaded in the “Items panel”, select the layer and go to “Item Properties” tab. Edit the text in the “Main Properties”. Change the font size and style in “Appearance” in “Item Properties”

Figure 10. Add Label is added to Items List

Figure 11. Entering the Title Text
- Change the font size and style in “Appearance” in “Item Properties”.

Figure 12. Changing Font Appearance
- A frame can be added and background colour can be changed in the “Frame” and “Background” under “Item Properties” to highlight the map title.

Figure 13. Updating Frame and Background to Title
Adding the Map
- To add the map to the canvas, Go to Layout -> Add Map. Click and drag to the extent where the map is required to be placed on the canvas. (Refer: Figure.8)
- The map will be added to the items list. To edit the setting go to “Item Properties”.

Figure 14. Map added to Items List.
- The scale of the map can be changed in the “Main Properties” under “Scale”. Set the scale at which the map is to be displayed in the canvas.
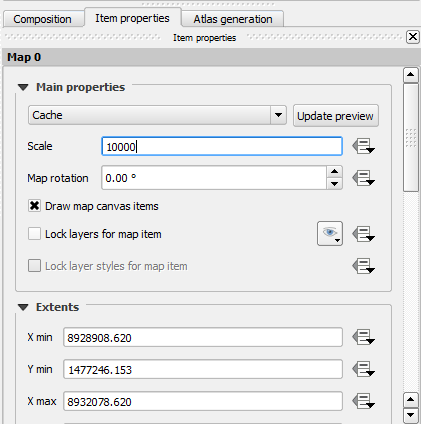
Figure 15. Setting Scale for Map
To display the current map, you can choose between three different modes in the map Item Properties tab:
Rectangle only displays an empty box with a message ‘Map will be printed here’.
Cache renders the map in the current screen resolution. If you zoom the Composer window in or out, the map is not rendered again but the image will be scaled.
Render means that if you zoom the Composer window in or out, the map will be rendered again, however it is allowed only up to a maximum resolution after that the map would not render clearly because of space constraint.
Cache is the default preview mode for newly added Print Composer maps.


Adding Legend
- To add a legend, go to Layout -> Add Legend. Click and drag where the legend is to be placed and it will be found that the legend is added to the items list.

Figure 18. Add Legend

Figure 19. Items List
- Set the legend title in the Main properties. Disable the auto update and edit the layers that are to be placed in the legend and change the font and colour for each content in the “Fonts” tab.

Figure 20. Editing Legend Content and Colour
- The column count of legend can be modified by editing the “count” in “columns”. The spacing can also be modified in the “Spacing” tab.
- Frame and background can also be edited in the properties.
Adding Scale bar
-
Click Layout -> Add Scalebar. Click and drag where the scale bar is to be placed. The scale bar will be added to the items list (Refer: Figure.8). In the “Item Properties” of scalebar edit the settings as required. The title for the scale bar can be added by repeating the same procedure followed while adding the title.

Figure 21. Scale Bar added to Items List
- In the map properties, select the map for which the scale is to be placed and select the style of the scale bar.
- In the Units, select the scale units and in “Segments” the segments to be available in the scale bar.

Figure 22. Adjusting Units and Segments
- We can choose the scalebar units to any of the given choice based on our usage of the map but in here meters has been selected as it is standard units. The scale bar length would be varying to each units type given, so we recommend using the suitable units for better maps.

Figure 23. Scalebar Units in Map Composer
- Select the font and colour for the Scale bar and add frame and background as per requirements.
Adding Image
QGIS itself has the most commonly used SVG markers and other map images in one of their folder path ~\QGIS_2_**\apps\qgis-ltr\svg.
Any image can be added to the map layout. Here we will use an existing arrow image to define North.
- To insert Image or North Arrow into the canvas, Click Layout -> Add Image. Click and drag where the Image is required. The image layer will be added to the Items list. (Refer: Figure 8)

Figure 24. Image Added to Items List
- To load the Image from a folder, go to “Main Properties” in the Image source Browse for the File and click open. Thus the image from the directory can be loaded.
- To select it from the directory, Go to “Search Directories” and click on the image that is required. (North Arrow can be selected by this method).

Figure 25. Add Image to Canvas
- Frame and background can also be modified for the Image added from Item properties.
After adding the basic map elements or layers explained above, the final map would look similar to Figure 25 shown below.

Figure 26. Final Output Map with all added layers
In our next blog about map composer, we will document additional details of other map elements like adding attribute table, grids, presets, overview maps and atlas generation within QGIS print composer tool.
Try these steps put by downloading the latest QGIS from https://qgis.org/en/site/forusers/download.html
Sample data can be downloaded from https://qgis.org/downloads/data/
Leave a comment