


Advanced Features of QGIS Map Composer
Introduction
In an earlier blog of QGIS Map Composer, we have explored the basic map elements and procedures to create them using print composer tool. A professional map which has commercial usage needs to be informative, accurate without any clutter. So there is a need to enhance the readability of the map. In here, we are about to explore some of those advanced map elements which are essential in any usable map or atlas.
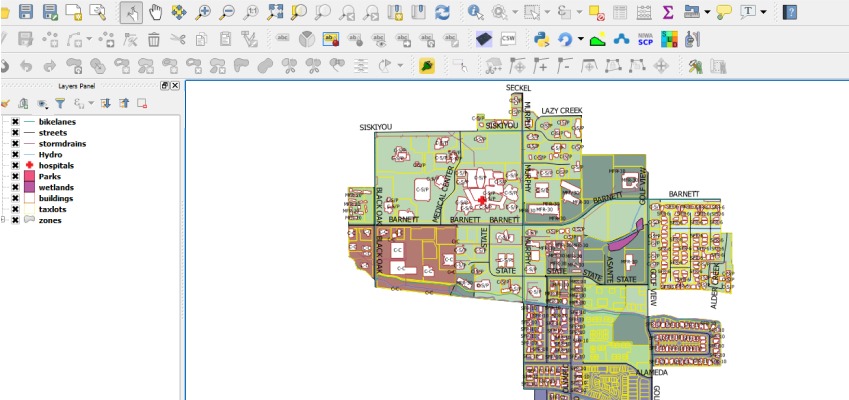
Setting Visibility Map Preset
In the map composer to render different layers and its styles for each composer you had to use “lock layers” and “lock layer styles”, it saves all of the layers and their styles and properties. Doing this for each composer, it can quickly balloon the size of the QGIS file. This can make it take an extremely long time to open a project and cause a lot of performance issues, and inevitably will corrupt your QGIS file. Following a visibility, preset simply takes references the style for the layer rather than duplicates it.

Image 1: Lock layers and styles
For large projects with a large number of layers and composers, it’s advisable to use layer presets and the “Follow visibility preset” option within the composer.
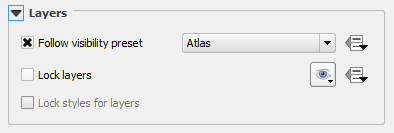
Image 2: Selected Follow visibility preset for Atlas preset
We recommend of setting preset from the start, which allows us to save the layers styles reference and also renders any particular set of layers in a single click on that preset.
Adding a preset
Select the layers and groups, you’d like to set visibility presets for. Now click “Manage Layer Visibility” 

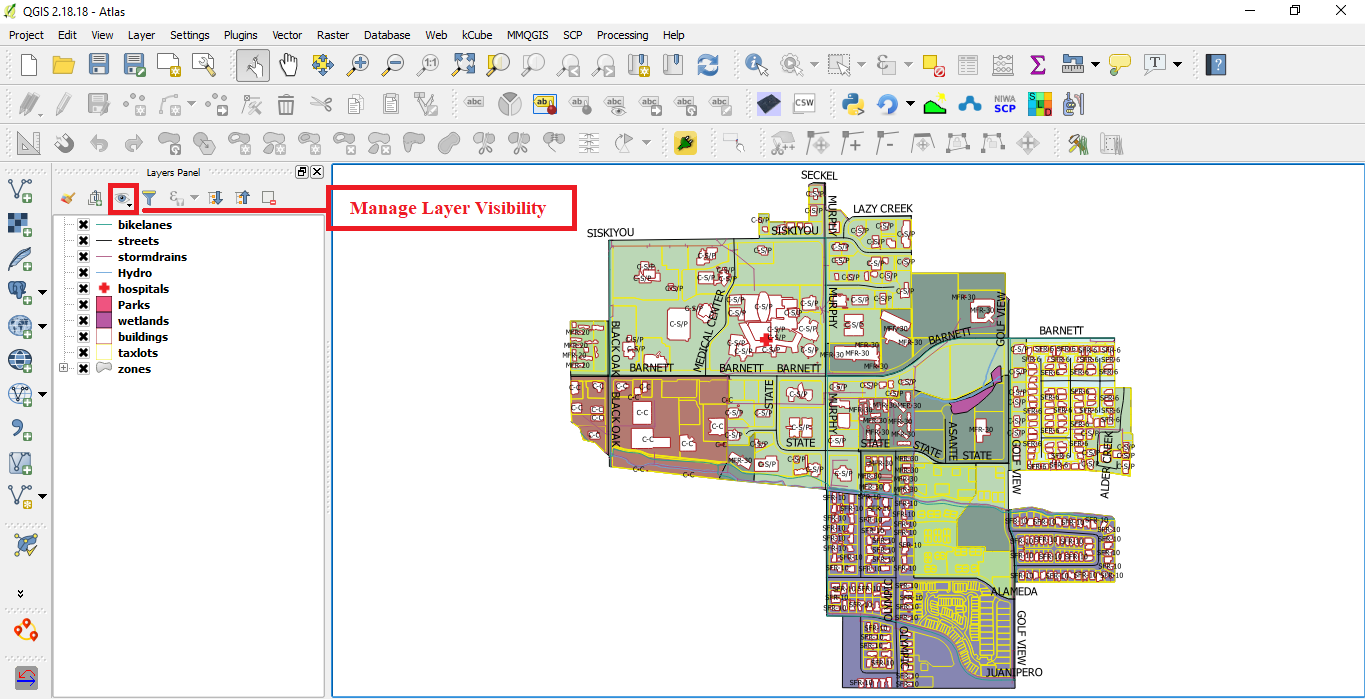
Image 3: Manage Layer Visibility tool in QGIS UI
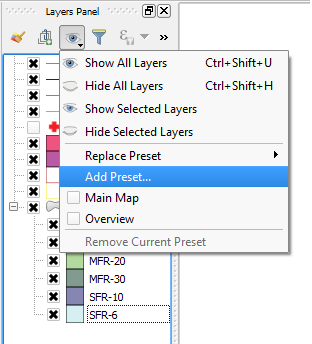
Image 4: Adding a new preset in QGIS layer Panel
Any changes in the layers which are a part of any preset will be reflected in the print composer map if refresh
Overview Map
QGIS print composer tool allows multiple map windows inside a single map template. And also with the coolest addition of “layer preset” you can actually add many map windows that renders different layers with different styles at the same time.
In all the professional maps there would be an overview map showing the overall area or exactly which part of the area dealt in the map. It always ensures that users have the overall knowledge in which part they are dealing with inside a larger area.
Adding an Overview Map
We would recommend using preset for selecting the layers which will appear in the overview map.
You can add an overview map by going to the “Layout” and clicking “Add Map” from the drop-down and draw the map inside the map template at where you want. Now go to the “Item properties” of Map 1(overview map) and click on “Follow visibility preset” to select the “overview” preset. Your overview layers would be added to the map
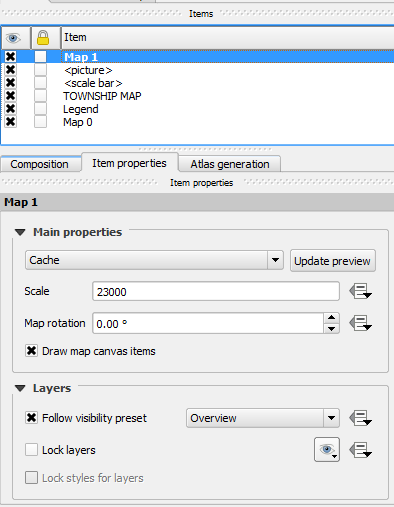
Image 5: Added a new overview map to the map composer
After adding the map, scroll down “Item properties” and go to the “overviews” expand it. Click the mark
Overview map has a quick indicator which allows the users to have a check on the current site or region they are working on. It is an essential part of the overview map which would be invaluable for creating an atlas or map book.
Map frame is set to the Main map(map 0) because the overview map should always highlight the region shown in the map 0. It will change dynamically if any changes occurred within map ‘0’ region.

Image 7: Adding Overview of the main map to the overview map

Image 8: Sample output of Map with the Overview map
Adding Grids
Grids are mainly added into printable maps so that the users could easily measure the distance or area on the maps.
Based on the CRS of the layers in the main map, we can add grids to our map composer. Grid option shows the coordinates of the layers in the map window based on the CRS selected for the map composer.

Image 9: Adding Grid to the map composer
The grids can be added by “Grids” option inside the “Item properties” of map 0. You have to expand the submenu and by clicking the mark
If you expand the component
In component
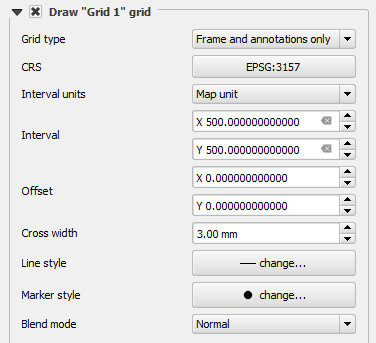
Image 10: Selecting Projection and Grid Configuration
In component
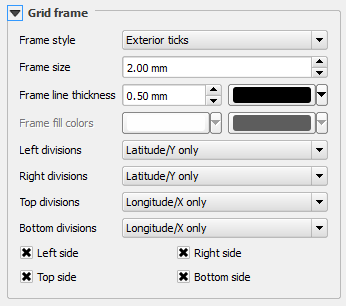
Image 11: Setting frame styles for our Grid
In component

Image 12: Setting up the coordinates display and its styling
To avoid clutters we may need two grid styles in some cases like labelling should be on 500 units interval and grids lines running in 250 units. We can add two or more grids with different configurations.
It is advisable to use the same projection [Here : EPSG:3157] for both grids added as the data shown on the map are in EPSG: 3157. In this example, we have added two grids with different grid style configurations.

Image 13: Adding two grids with different grid style configuration

Image 14: Output map frame with two different grid style configuration
Adding Attribute table
Along with a map, you can show the attribute table of any important you wish to share with the users. For example, you may want to show the volumetric quantities those of any plot or survey land covered by your map. If the values are stored in the attribute table of those layers you can easily add them to your map using “Print Composer” tool.
Attribute table can be added to your map by clicking “Layout” and selecting “Add Attribute Table” option. After adding the attribute table you can modify the table columns and rows by moving up and down, removing the unnecessary columns, sorting the values of those selected columns. These can be achieved by clicking the “Attributes” option in the “Item properties” of the attribute table.
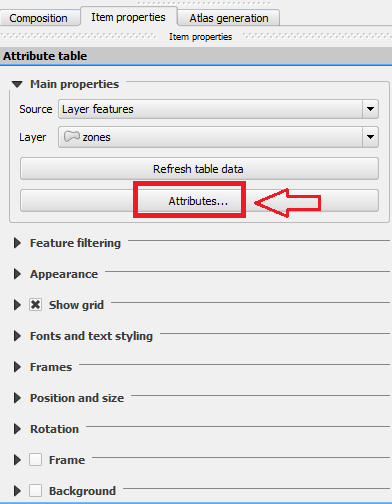
Image 15: Adding the attribute table into map composer
Once clicking the “Attribute” option , a new window pops up where you can modify the above mentioned changes needed in your attribute table.
As mentioned in above we can select the fields and edit their attributes names, remove unnecessary columns and also change the alignment of the fields by using 

Image 16: Editing the attribute fields and removing the unnecessary columns
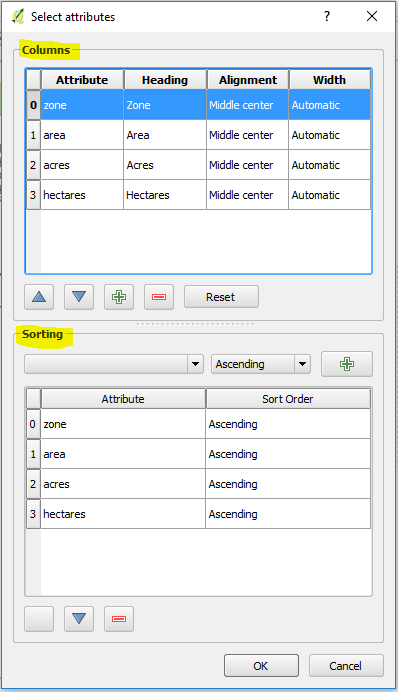
Image 17: Modification and sorting window of the attribute table
You can see the other attribute components underlying in the “Item properties” , they each have their own unique purposes of changing the attribute table structures.
In option


Image 18: Option for filtering the attribute table values
Other components of attribute table could be used to alter the table appearances, font style, size and other alignment purposes. You can explore them by applying them to your own maps.
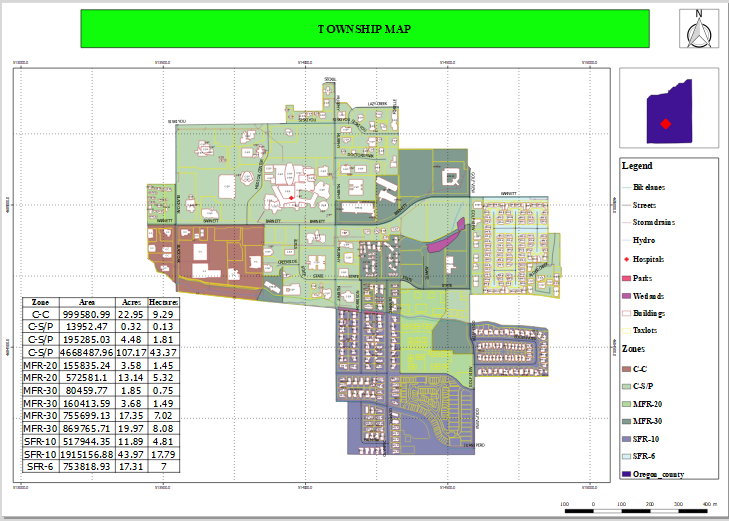
Image 19: Sample output of our map with grids and attribute table along with other map elements
Try these steps by downloading the latest QGIS from https://qgis.org/en/site/forusers/download.html
Sample data used can be downloaded from https://qgis.org/downloads/data/
Leave a comment